
Unclear Messaging
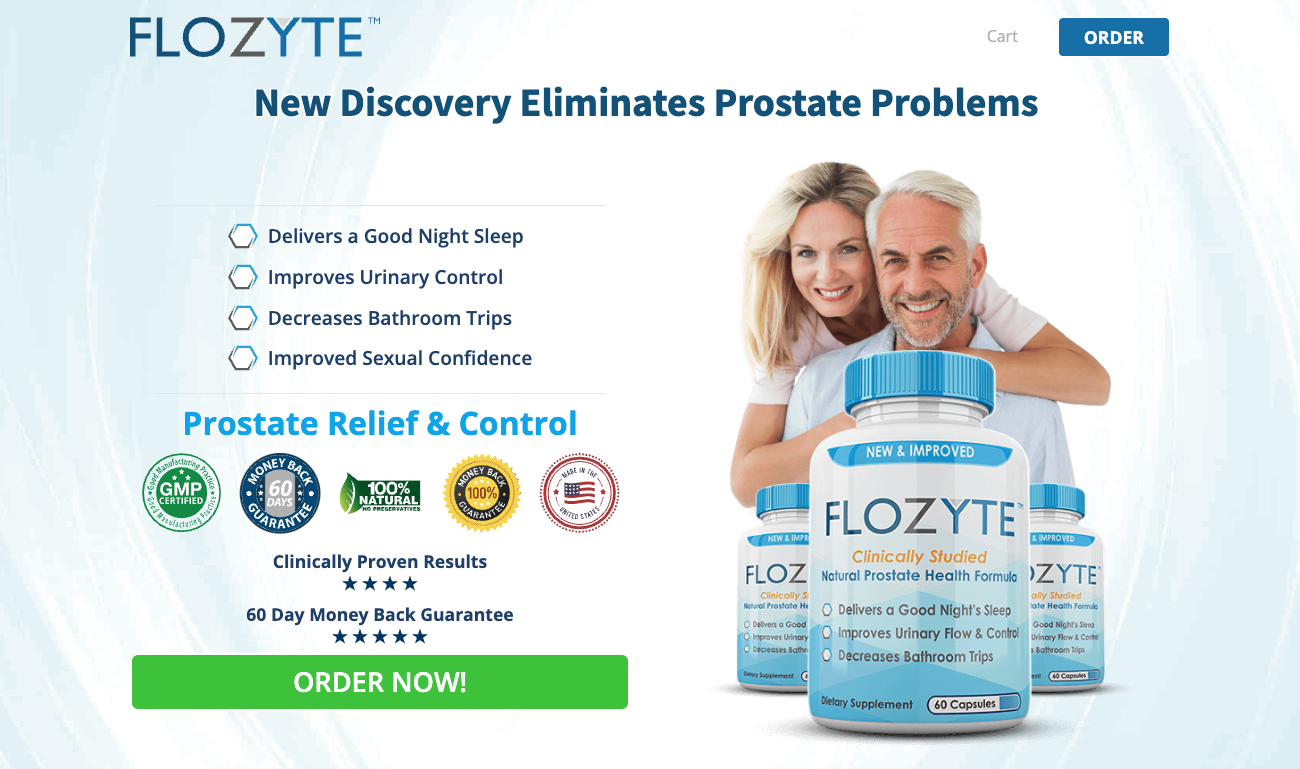
People cannot quickly tell why your offer fits their needs.
Clarify the value in the first screen.
Website Design & Development
More Qualified Leads. More Completed Sales.
Turn visitor behavior into a clear improvement plan. We examine the customer journey, verify what your website measures, and use focused experiments to improve the path from interest to revenue.

Measure What Matters
Connect website actions with lead quality and sales.

Test a Clear Hypothesis
Compare experiences with a defined decision rule.

Improve Business Value
Judge success beyond clicks and raw form totals.
The Business Question
A higher form completion rate is useful when those inquiries become customers. A shorter checkout is valuable when it produces retained revenue. CRO starts by defining the outcome your business actually needs.
We map the steps between the first visit and the sale, then examine where people hesitate and where measurement loses the trail. Customer research, usability evidence and funnel data shape the hypothesis before a design changes.
Use conversion rate to understand efficiency. Use qualified leads, revenue per visitor and margin to understand value.
From Visitor to Business Value
Converting visitors ÷ eligible visitors × 100
Count each eligible visitor once for the agreed outcome and observation window. Match the numerator to the denominator.
Revenue ÷ eligible visitors
Define currency, refunds, cancellations and timing. Revenue and profit answer different questions.
Common Conversion Roadblocks
We find the barriers that make interested visitors hesitate, then turn them into a focused improvement plan.
People cannot quickly tell why your offer fits their needs.
Clarify the value in the first screen.
Important answers are buried or difficult to find.
Give visitors a simpler route forward.
Buttons and forms leave the next step unclear.
Make the action specific and visible.
Small controls and slow pages interrupt interest.
Make the experience easier on every screen.
Visitors need reassurance before they reach out.
Put genuine evidence at the decision point.
More activity does not always mean more business.
Connect contact actions with lead quality.
Follow the Whole Journey
Track the path to revenue instead of treating every click as an equally valuable conversion.
01
The audience and unit defined before the test.
02
Delivered forms, connected calls or confirmed orders.
03
Inquiries that meet your agreed business criteria.
04
Won business and value after the decision cycle.
A useful funnel preserves the same definitions across stages. Event totals, sessions and people are different units. A visitor who submits twice should not silently become two converting visitors.
Measurement Before Optimization
The first deliverable is a measurement map: what fires, what qualifies, where the record arrives and how it connects to the eventual outcome.
01
Confirm a valid inquiry reaches the receiving system. Separate attempts, errors, spam and duplicate submissions. Carry a stable lead ID into qualification and sales feedback.
02
A phone link click does not prove a call connected. Review connected calls and dispositions, then distinguish qualified conversations from missed calls and unrelated inquiries. Duration can support a rule; it is not quality by itself.
03
Reconcile purchase events with unique order IDs, value and currency. Check refunds and cancellations. Add to cart and checkout steps diagnose friction; confirmed orders and retained value judge the business outcome.
Validate event delivery against forms, call records and the order system. Check duplicate tags, consent coverage, internal traffic and missing records by variant. Attribution describes credited touchpoints; a randomized experiment tests the effect of the website change.
The Customer Decision Journey
We improve the decisions between arriving on your website and becoming your customer.
Attention
Make the offer immediately relevant.
Understanding
Answer what matters to their decision.
Confidence
Support the offer with credible proof.
Action
Give interest a clear place to go.
Choose the Right Experiment
Start with a question your traffic can answer. The test design determines what you can learn.
A/B Testing
Randomly assign visitors and keep their version consistent. Test one focused hypothesis or a coordinated redesign. A bundled redesign estimates the combined effect, not the contribution of every changed element.
Multivariate Testing
Two headlines and two forms create four combinations. This can reveal whether a form works differently with each message. Plan traffic around the effects and interactions you need to estimate, plus the number of comparisons.
When traffic cannot support a complex test, a focused A/B comparison is often more useful. Confirmed defects, customer interviews and usability studies can also guide improvements without waiting for a large experiment.
A Testable Improvement
A good test connects an observed problem to a measurable outcome. It also defines what must not get worse.
Evidence
If form errors and usability research identify unnecessary required fields as a barrier, test whether making those fields optional improves valid inquiries.
Hypothesis
Making those fields optional should reduce abandonment for visitors who are otherwise ready to inquire.
Decision
Primary outcome: valid inquiries per assigned visitor. Guardrails: qualified leads per visitor, spam rate and delivery errors. Agree on the worthwhile effect and stopping rule before launch.
Our CRO Process
A repeatable process makes the recommendation easier to trust and the next decision easier to make.
01
Agree on the business outcome, eligible audience, conversion window and event definitions. Reconcile records and test delivery.
02
Review funnel steps, device differences, customer questions and usability barriers. Rank hypotheses by evidence, likely value and effort.
03
Choose the test design, primary metric, guardrails and traffic requirement. Build the variants and QA the experience and tracking.
04
Keep assignment consistent. Check the observed traffic split against the plan and investigate missing events, errors or sample ratio mismatch.
05
Report the effect, uncertainty and downstream quality. Follow the chosen statistical method and decision rule rather than stopping at the first positive dashboard.
06
Roll out a supported change, reject a weak idea or record an inconclusive result. Preserve what the test taught and define the next question.
The Math Behind the Decision
The size of the change worth detecting matters as much as the current conversion rate. Use these planning relationships to set realistic expectations.
Absolute Change & Relative Lift
+0.4
Percentage points
+20%
Relative improvement
Relative lift = (2.4% ÷ 2.0% − 1) × 100. At 10,000 visitors, the planned difference is 40 additional converting visitors.
Traffic & Sensitivity
21,109
Visitors per version for 20% lift
43 days
At 1,000 eligible visitors a day in total
Planning assumes a 2% baseline, equal allocation, independent visitor outcomes, a two sided 5% significance threshold and 80% power using a normal approximation. Allow additional time for conversion outcomes to mature.
Reading the Result
Suppose each version has 10,000 visitors and records 200 versus 240 conversions. The observed difference is 0.4 percentage points. A conventional approximate 95% interval for that difference runs from about −0.007 to +0.807 percentage points, crossing zero. A positive estimate alone does not establish an improvement.
Choose the sample and stopping rule before launch. For a fixed horizon analysis, do not stop when a dashboard first shows significance. Sequential testing requires a method designed for repeated monitoring. Review uncertainty, the minimum worthwhile benefit and guardrails together.
Experience That Supports the Work
Clear product value, credible proof and a visible next step make stronger hypotheses than decoration.
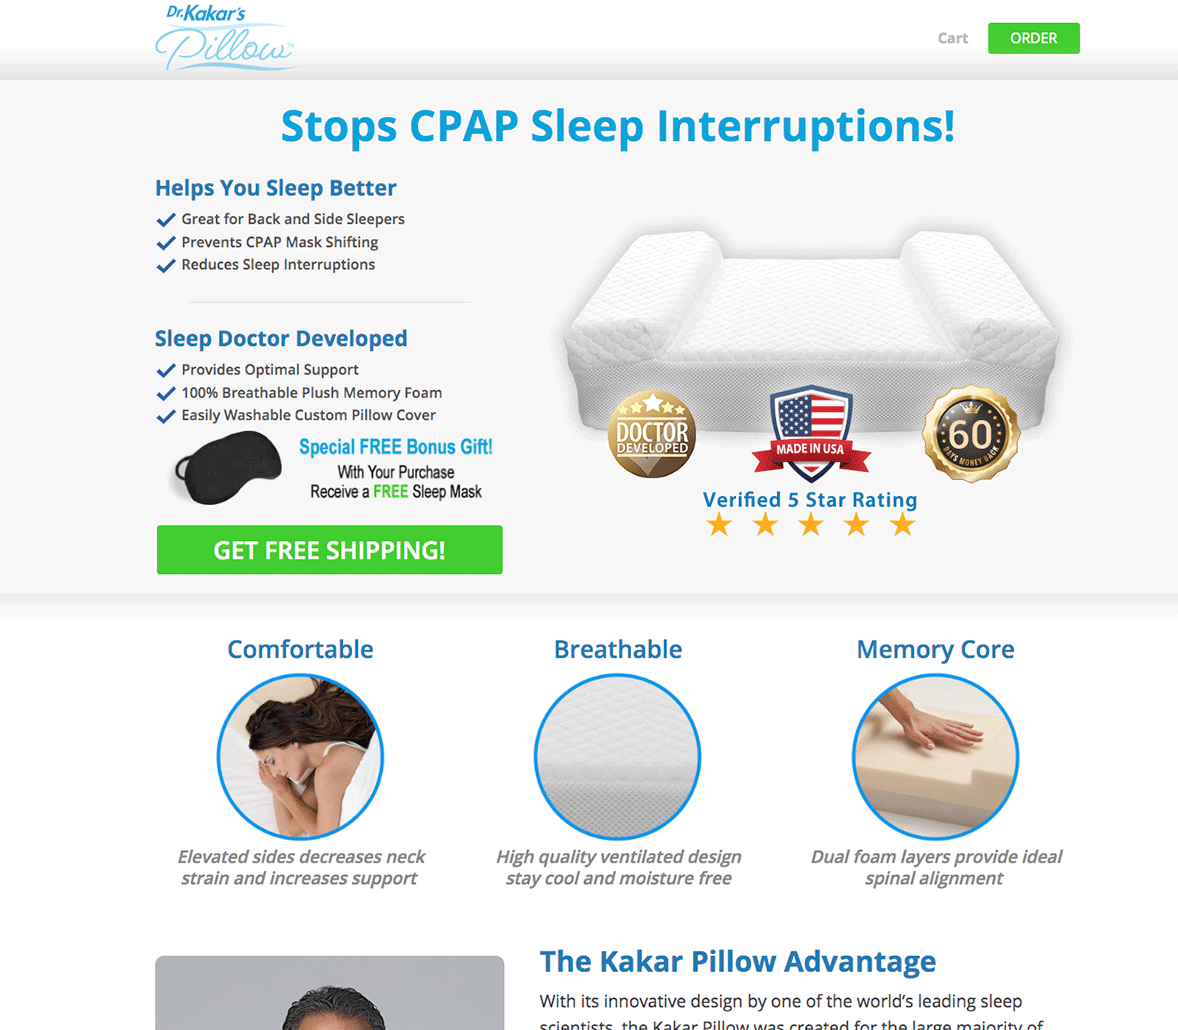
Our ecommerce work brings the offer, product information and purchase path into one coherent experience. For CRO, those same details become questions we can investigate and test.
Does the first screen answer the customer’s main buying question?
Is delivery, product suitability and purchase reassurance visible when it matters?
Can we connect checkout progress with confirmed orders, refunds and value per visitor?
Client Feedback
With Revenue Surge, we ran creative digital marketing campaigns designed to optimize conversion as well as average ticket price. Dave also helped engineer a redesign of our company website, which was more than needed.
Jason Galvin
Google · November 7, 2022Dave at revenue surge made a huge difference for my company. He reworked the website, enhanced the SEO, and helped me launch my second location.
Captain Tony Young
Google · February 6, 2025Frequently Asked Questions
CRO is a structured process for improving the share of eligible visitors who complete a valuable action. It combines customer research, experience improvements, reliable measurement and suitable experimentation. The outcome may be a qualified inquiry, connected call, completed order or another agreed business goal.
The answer depends on traffic, the baseline rate, the smallest worthwhile improvement and the customer decision cycle. At a 2% baseline, planning for a 20% relative lift with a conventional two sided 5% threshold and 80% power takes about 21,100 eligible visitors per version. We assess feasibility before promising a test schedule.
A/B testing compares experiences. Multivariate testing compares combinations of elements and can examine interactions. Two headlines and two forms create four combinations. More complex questions need a suitable traffic and analysis plan; a simpler test often makes better use of limited traffic.
The measurement plan can distinguish telephone link clicks, connected calls, qualified conversations and won business. Connecting later sales requires suitable call records or CRM data and stable identifiers. We assess data availability, matching and the conversion window before choosing the primary outcome.
We compare recorded actions with the receiving systems, check duplicate tags and repeat events, and validate order or lead identifiers. During a test we inspect allocation, event loss and errors by variant. A planned 50/50 split that departs beyond expected random variation needs investigation before interpreting results.
An inconclusive result does not establish that both experiences are equal. We review the interval, available traffic and practical value of the possible effects. The decision may be to retain the current experience, run a better supported hypothesis or gather more customer evidence. We do not keep changing the stopping rule to find a winner.
No. A change can increase submissions while reducing lead quality. We agree on the primary metric and downstream guardrails before launch. Qualified leads per visitor, customer acquisition cost, retained revenue and margin may matter more than raw action totals.
Measurement & Testing References
Ready to Improve Your Conversions?
Tell us about your website and where visitors get stuck. Let’s find a practical way to help more of them take the next step.
Discuss Your Website →